

What if I told you there was a way to reach an audience larger than the one Netflix has through YouTube analytics?
It’s possible!
YouTube videos reach more than 2 billion users a month—about one-third of the entire internet’s traffic.
However, if you want to use YouTube videos to drive traffic and revenue, you need to deep into the data.
How do you know whether your video has impacted your business?
Through the effective use of YouTube analytics!
In the next few sections, I’ll explain what YouTube analytics is all about, how to access it, what metrics you need to track, and how to leverage this information for better ROI.
What Is YouTube Analytics?
YouTube analytics is the native analytics platform on the site, providing access to vital metrics about video performance including watch time, viewer demographics, traffic sources, impressions, and more.
What is the point of all this information?
This data is here to help you understand what type of content your audience is interested in so you can improve your YouTube strategy.
If you hate wading through data, you’ll be happy to know YouTube analytics is pretty straightforward.
Instead of overwhelming yourself with a ton of information, you can choose to focus on the data that matters most to your brand.
Why Is YouTube Analytics Important?
Simply put, knowing about your YouTube videos’ performance levels is vital to understanding how effective your efforts have been. When you know that, you can create more of the content your viewers love.
Why does YouTube Analytics matter so much?
For starters, YouTube is the second most popular website online. Period.
Further underlining YouTube’s popularity is that teens spend much more time watching YouTube than live TV—or even Netflix or Hulu.
This fact is of particular importance if your products appeal to this demographic.
But YouTube isn’t just for teens—people of all ages and demographics watch more than a billion hours of YouTube videos every day.
How to Access YouTube Analytics
Ready to dig into the data? Here’s how to access YouTube analytics.
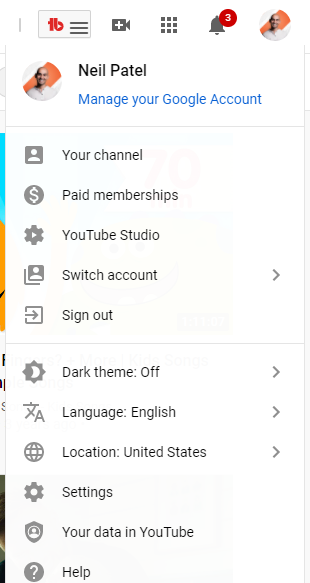
From the YouTube homepage, navigate to the top right corner, where you see your account’s avatar.
Click on the image, and you’ll see a drop-down list of account options.
Select “YouTube Studio.”
On the next page, you’ll see the Studio dashboard.
There’s a sidebar on the left, which allows you to access different parts of your account.
Click “Analytics,” which takes you to an overview of your YouTube channel’s performance.
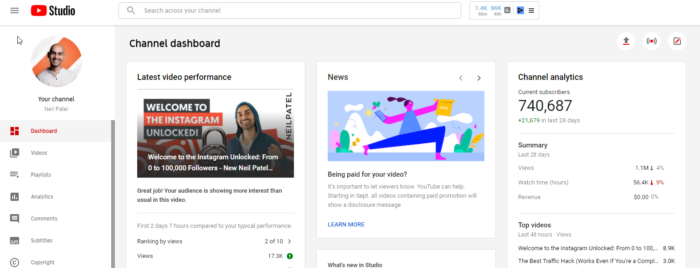
The overview page provides details like views, watch time, subscribers, estimated revenue, and real-time reporting.
You’ll also see four primary analytics tabs:
- Reach
- Engagement
- Audience
- Revenue
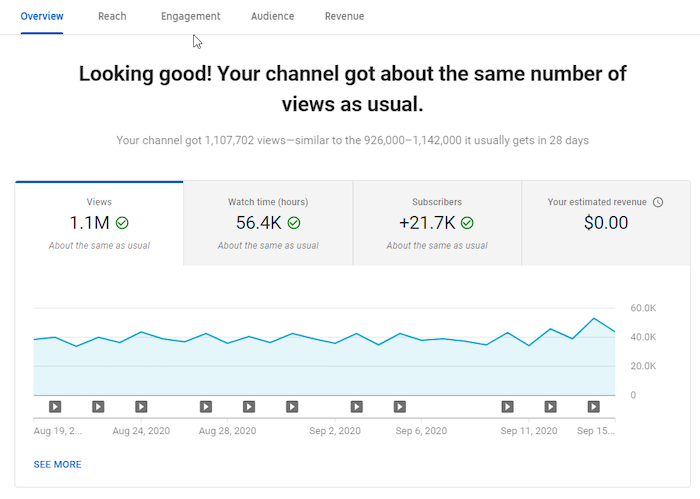
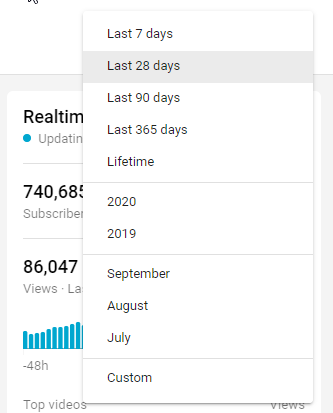
The statistics you see here are for the last 28 days. That’s YouTube’s default setting.
However, you can view metrics for a different period by clicking on the drop-down on your screen’s top right corner.
What if you want to see how well your videos have performed within 60 minutes or 48 hours of hitting the publish button?
The real-time report provides these details.
YouTube has information in place to help you understand the metrics, even if you’re a beginner.
All you have to do is hover over your chosen metric or click the “i” in a circle appearing near the metric’s name.
Here’s an example:
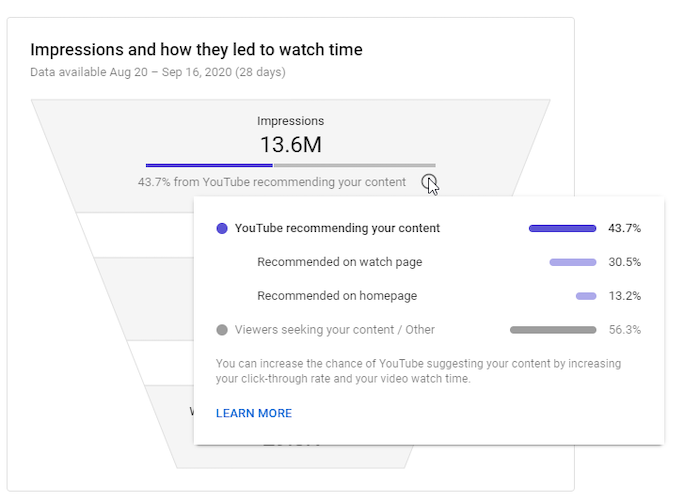
If you want to understand the metrics further, the “Learn More” link at the bottom of the box comes in handy.
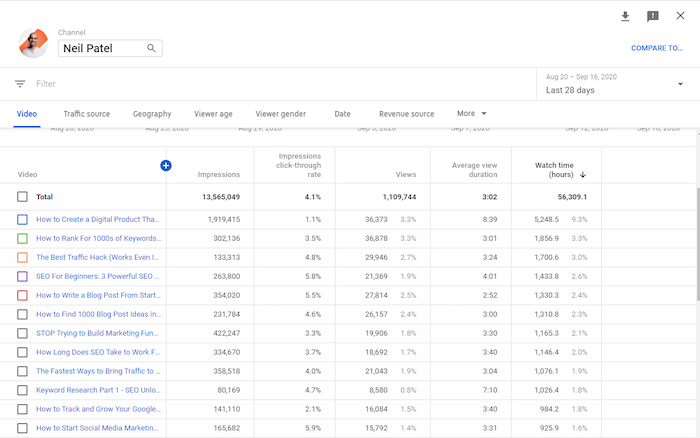
In addition to overall channel metrics, you can also view individual videos’ metrics.
To access video metrics, click on any video from the overview page.
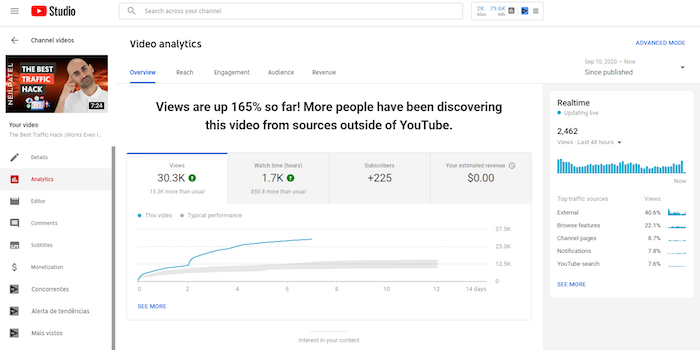
Click on “See More” to dive deeper into the analytics of a specific video.
Alternatively, you could click “Advanced Mode” at the top right corner.
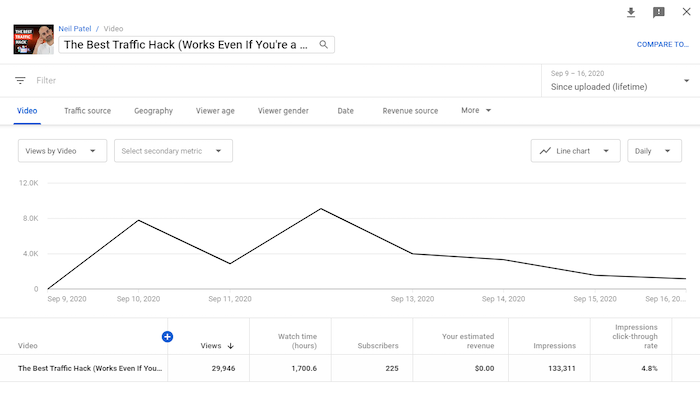
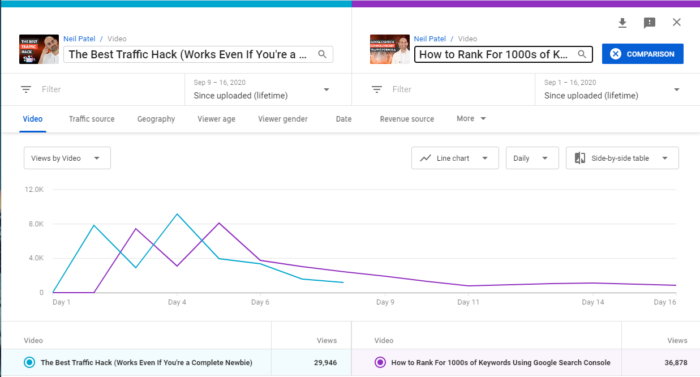
Want to see how two videos performed against each other?
The comparison feature allows you to compare two videos, one video against itself over different periods, or a video with a group of other videos.
If the video is part of a series, you can discover how it compares to the others.
Additionally, you can discover if there is a difference in seasonal video performance.
To access this feature, click “Compare to” at the top right corner of the page.
Here, you can select the periods, video, or group to compare.
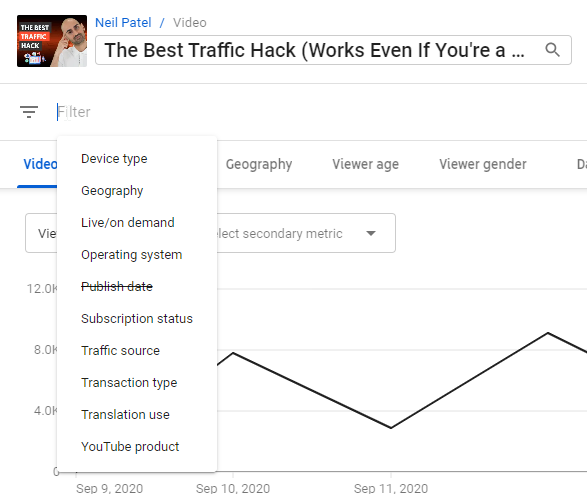
Another useful option is to add filters to your metrics.
You can find the filter option beneath the video’s title in the upper left, underneath the image from your video.
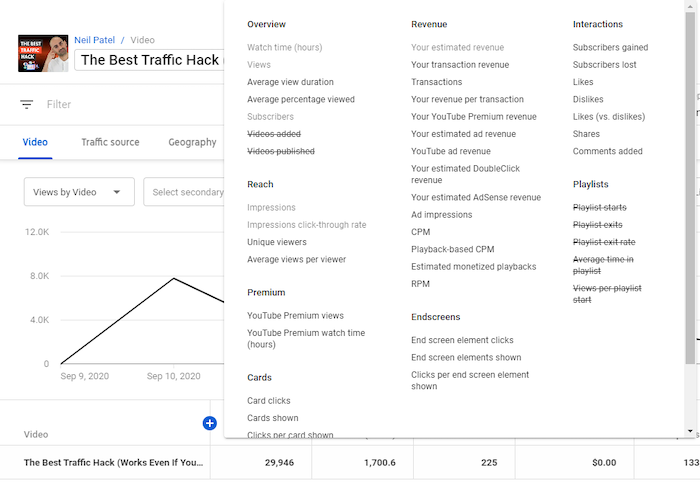
Clicking the “+” icon at the top of the table of metrics brings up a big list of metrics you can check out.
Want to save or share your data? You can easily export it for further analysis.
To do this, navigate to the top right corner of the page you want to export and click the download icon—a downward-facing arrow with a line beneath it.
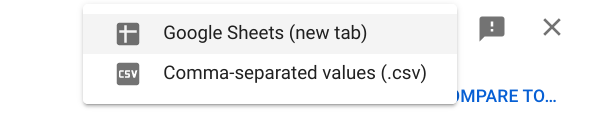
This will bring up two options—Google Sheets and .csv—so you can choose the format you prefer.
Vital Metrics to Track on YouTube Analytics
It’s easy to get lost in the sea of data on various marketing platforms. There’s so much information, and it’s understandable if you get overwhelmed by all the filters, options, and tools.
And the same applies to YouTube analytics.
Don’t worry, though: YouTube analytics is comparatively easy to use.
Keep in mind you only need to view metrics answering a specific question you have.
These questions might include:
- How do viewers engage with our videos?
- When do they exit the videos?
- Which videos convert the most viewers to subscribers?
- Do our YouTube audience demographics match with our buyer personas?
With these and more questions in mind, it should become easier to view the metrics you need.
Below, I’ll share seven essential metrics in YouTube Analytics and insights you may derive from them.
1. Demographics
When creating a video, you need to know who you’re targeting—and who’s watching.
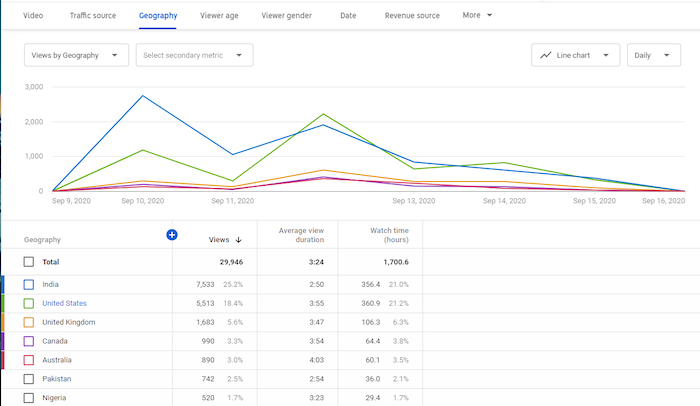
YouTube’s demographics data reveals details like the top countries and cities your viewers are watching from, viewers’ ages and genders, the times and days they most often watch videos, and more.
Location
If you have many viewers from a particular country or city, and your brand allows for this, you could tailor content to those locations. If you’re advertising a local product, but your videos aren’t generally being viewed locally, it may be time to investigate your keywords.
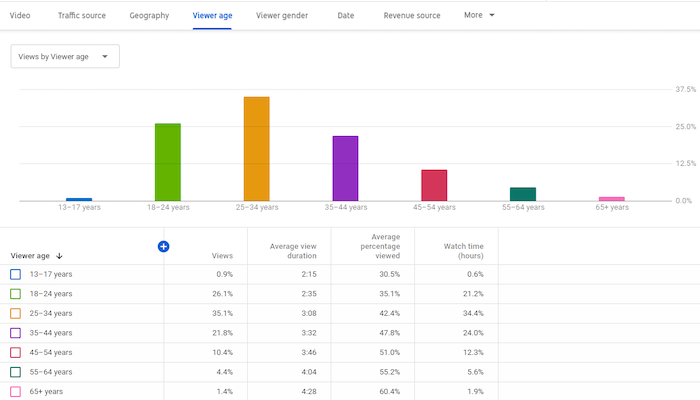
Age and Gender
Knowing who your audience is can help you create relevant and appropriate content. After all, you wouldn’t want to produce R-rated content if your viewers are typically 13-17!
Furthermore, the times and days viewers are on YouTube provides insights into when you should publish new videos.
If you run YouTube ads, having demographics information can also improve your ability to target content accordingly.
Finally, you can compare your demographics data to your buyer persona.
Do they match?
If so, great! If not, will you change your buyer persona or your content?
2. Traffic Source Types
Traffic source types indicate where viewers find your videos, such as YouTube search, Suggested videos, Channel pages, direct visits, views from external sources, and others.
In addition, you’ll see how viewers from each source behave.
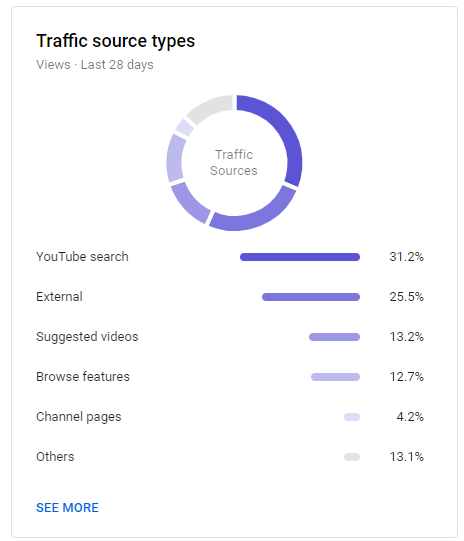
These metrics provide information about the sources responsible for your video views. For example, you might find your blog drives a ton of traffic to YouTube, which means you may want to embed more videos in blog posts.
For more details about how people found you, you can click on each source. For instance, clicking on “YouTube search” will show you what keywords led users to your videos.
You can also see which sources contributed little to your views and try to figure out how to boost those areas.
For example, a low number of views from YouTube search might mean you need to improve your YouTube SEO.
Or, a small number of views from Suggested videos might indicate you need to engage your audience better. Higher engagement means YouTube may see your videos as valuable and suggest them to people viewing similar content.
There are even more insights to uncover once you dig into the data.
3. Watch Time
Getting a lot of YouTube views is good, but getting a high watch time is even better. “Watch time” is how long users spend watching your videos.
YouTube’s algorithm uses this metric to help it understand your content’s quality. This means a long watch time improves your chances of showing up as suggested videos and on search pages.
You can analyze each video’s watch time and compare it to the video’s length.
What types of videos have high watch times? What types have low watch times? Why do you think that is?
Considering the differences between videos with high and low watch times can help you create better content in the future.
You should also examine videos with a high watch time at a particular time of year. This could be a seasonal video—and if it did well, consider creating a similar video next year.
4. Subscribers
When a viewer clicks the “Subscribe” button, they’re confirming their interest in your content. They’re then more likely to see when you post new videos—and watch them.
YouTube Analytics displays the number of subscribers you’ve gained and lost during a given period.
You’ll also see which videos contributed to your subscribers count.
Which videos are responsible for a high number of subscribers gained? Which ones are responsible for subscribers lost?
Analyzing these changes can help you improve the content you create. For example, if longer videos tend to drive more subscribers, then you should focus on longer videos
You can also view subscription sources, which tells you where subscribers found your content.
There’s another way to understand what drives subscribers—comparing them with non-subscribers.
For example, you can compare these two audiences on metrics such as watch time, including the time spent viewing and what percentage of the video they watched.
Thirty seconds means something very different on a 45-second video than it does on a 45-minute video!
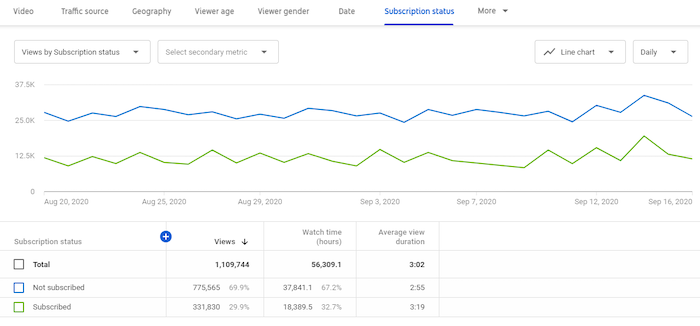
In the image above, there’s an anomaly. You see, non-subscribers are outnumbering subscribers significantly. This data indicates a need for further investigation—perhaps check their traffic sources.
5. Top Videos By End Screen
If you’ve ever watched YouTube, you know many videos end with images of other videos to watch. Those images are there to entice users to keep watching.

The metric related to this tells you which end screens accounted for the most clicks.
By clicking on “See More” in the engagement tab, you’ll see details such as end screen elements shown, end screen element clicks, and clicks per end screen element.
As a result, you can identify videos that keep viewers watching.
Why is a specific end screen more effective than another? Once you figure this out, apply the insights to other videos.
6. Top Cards
Card elements are interactive and allow you to promote other YouTube videos or links to your website. You can see an example in the image below—the “Suggested” bar is a card element.
Card element metrics show you details such as card clicks, cards shown, clicks per card, and more.
From these numbers, you’ll discover which cards were most effective at converting viewers.
Ask these questions:
- What makes these cards effective?
- Are cards more effective on some videos than others?
- At what time are cards most effective in a video?
- What makes some card teasers effective?
By diving deeper into these metrics, you can find answers to these critical questions.
7. Revenue
YouTube ads are essential to revenue. However, to run YouTube ads, you need at least 1,000 subscribers and 4,000 hours of watch time. Focus on making great content using your metrics as a guide to get to these numbers.
You can see an example of an ad overlaying a YouTube video below.

If you’re running ads as part of the YouTube Partners Program already—or when you get to that point—the revenue section of analytics is crucial.
Here, you’ll find details such as your revenue sources, top-earning videos, ad types, monthly estimated revenue, YouTube Premium revenue, and more.
What are the top-earning videos? How are they different from the low earners?
You may get answers to these questions and more by diving deeply into revenue analytics.
All that said, you don’t have to monetize your channel through ads—I don’t do this myself. Instead, I use YouTube for branding, education, and to drive traffic to other resources.
Other YouTube Analytics Tools
YouTube analytics provides a ton of metrics about your channel performance, but it’s not the only source of data available.
That’s why you should use other analytics tools to gain more insight into your YouTube campaigns.
Using these tools, you can obtain analytics for other channels in your industry, enhance YouTube SEO, and get recommendations to improve.
Here are three other tools to better understand your YouTube video performance.
Vidooly
Using your YouTube analytics information, Vidooly provides suggestions about how to improve your videos.
They also grant access to video tag analysis—meaning the words in your video’s metadata—so you can discover high-performing tags.
To help you rank higher in YouTube keyword searches, Vidooly also has a keyword tool that may boost your videos’ SEO.
If you run influencer marketing campaigns, Vidooly can help you figure out which influencers may help grow your channel.
ChannelMeter
ChannelMeter provides access to extremely detailed audience insights.
Beyond that, you can monitor how videos from influencers perform. This is handy if you run YouTube influencer marketing campaigns—or if you want to emulate some of their ideas.
ChannelMeter also allows you to check on your benchmarks and follow trends among similar videos so you can adapt accordingly.
Unmetric
One of Unmetric’s most significant features is the benchmarking tools. These tools allow you to compare your strategy against your competitors.
For example, you can look at your competitor’s click-through rate, engagement rate, and video completions. This tool can help you develop campaign goals and identify new trends.
Furthermore, you can see how you fare against your competitors and obtain insights that may boost your campaigns. They even provide ideas for content creation.
Conclusion
YouTube Analytics is essential to running any successful YouTube campaign.
You can learn about your audience, what you’re doing well, and where you can improve—without being bogged down by unnecessary data, thanks to YouTube Analytics’ helpful filters.
What aspects of your videos do you think YouTube analytics can improve?
The post How to Optimize Your Videos Through YouTube Analytics Data appeared first on Neil Patel.
source https://neilpatel.com/blog/youtube-analytics/
kebo88 | kebo88 | kebo88 | slot gacor | slot gacor | slot gacor | kebo88 | slot gacor | kebo88 | slot gacor